Answer:
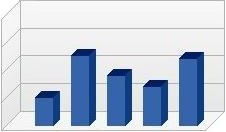
A bar chart makes numerical information easy to see by showing
it in a pictorial form. A bar chart is a chart with rectangular
bars of lengths proportional to that value that they represent.
Bar charts are used for comparing two or more values.
The bars can be horizontally or vertically oriented. Sometimes
a stretched graphic is used instead of a solid bar.

|