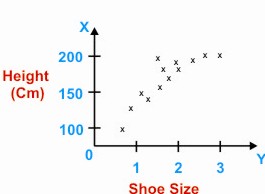
A scatter diagram
is a diagram used in statistics to compare two quantities, often to
show the correlation between them. For example a group of people each
have their height and shoe size recorded as a point on a graph. Because
these measurements have a high correlation the points are all close
to a line.
A scatterplot is a graphical summary of bivariate data
(two variables X and Y), usually drawn before working out a linear
correlation coefficient or fitting a regression line. A scatterplot
will show up a linear or non-linear relationship between the two variables
and whether or not there exist any outliers in the data.