A Venn diagram
is a diagram where regions are used to represent the relation between
two or more sets. It is a way of displaying how different sets of
objects overlap.
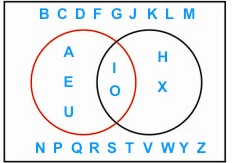
In the example shown here, the region inside the
rectangle represents the letters of the alphabet, the region inside
the red circle contains the vowels, and the region inside the black
contains the letters with two lines of symmetry. The region common
to the two circles then contains the vowels with two lines of symmetry.
Venn diagrams are named after John Venn (1834 - 1923) a Cambridge
mathematician.